Overview
My final undergraduate project investigated the challenges involved when introducing interactive tabletops into the home. This project was motivated by home-care applications, specifically delivering home reminders to a tabletop in the living-room.
Interactive tables would likely play the role of coffee table in the living-room, and as such would likely be as cluttered as our normal coffee tables are. Our initial investigation into regular surface use confirmed that clutter is, indeed, a problem! This poses a problem for home-care applications – important information may not be visible because of items on the tabletop.
A key aspect of this project was therefore to try and deal with the issue of messy tabletops when delivering information and home-care reminers. I approached this by using the internal cameras in a diffused illumination tabletop to capture the footprint of items on the table surface (shown as reflected infrared light). This information was then used to find a suitable visible area of the display to show reminders in.
The algorithm used to find a visible area of space is published in the Extended Abstracts of CHI 2013 [1], along with a discussion of some of the issues we encountered when designing for the home. This is a first step into investigating how to design for tabletops in the home.
For a video demonstration, please see:
[1] Unknown bibtex entry with key [MessyTabletopsWIP]
Algorithm
To capture the 2D footprint of items on the table surface, we first look at an image from the internal infrared cameras in the Microsoft Surface 1.0 tabletop. An example of such an image is shown below. White regions in this image are reflected infrared light from items atop the table.

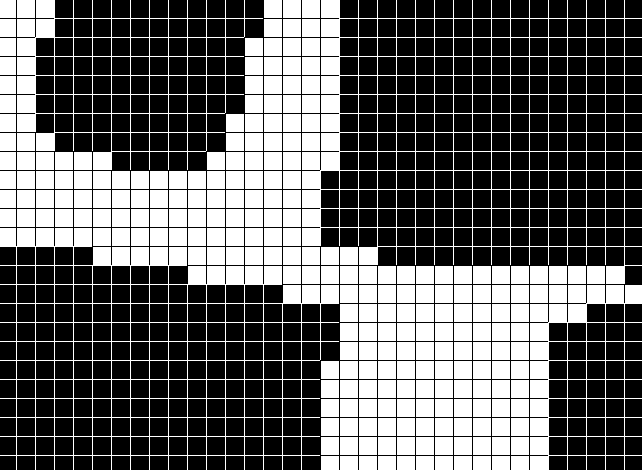
Image processing techniques can then be used to discover these item footprints, either using a blob detection algorithm or simple colour thresholding. We create a binary matrix where a value of 1 represents an item and a value of 0 represents a visible part of the display. The image below demonstrates how such a matrix may appear.
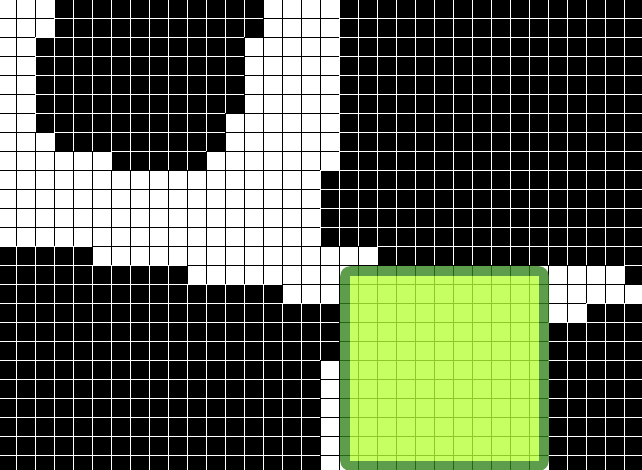
Our algorithm then finds visible rectangular regions suitable for display, using a dynamic programming approach. This algorithm iterates over each cell in the matrix and looks to see how far it can extend a border to the top, left and right. These borders will represent the largest rectangular region which can be “grown” from this cell. Border positions for previous rows and cells are re-used where appropriate. This is more efficient than a naive brute-force approach.
The image below shows the largest region found in the matrix shown previous. Here, the largest area rectangle was chosen; more suitable heuristics may be appropriate.
Design issues
During the development and implementation of this solution we came across several design issues.
1. Content placement
As described above, we just used the largest free space on the table for displaying content. Future work could look at more appropriate content placement on the table surface. For example it may be better to place content so it is closest to the user or in a position which is considered easiest to notice.
2. Changing position of content
When first implementing this solution we just moved content to a new position on the screen immediately. Some users noted that they were not sure if this was old or new information being shown. To address this we used animation; content being moved was animated along a smooth path so that it appeared to slide into view, whereas new content was gradually faded in. There may be more appropriate ways to identify content being moved to a visible location.
3. Occlusion caused by hands
Our initial implementation just used the raw image from the tabletop cameras alone to detect items atop the table. There is an obvious problem with this approach – the hand would appear as an item and content would shift away from fingers trying to interact with it! To prevent this, we used the information about touch contact points provided by the Surface 1.0 SDK to remove fingers from the item matrix.
4. Very messy tables
Sometimes clutter just builds and builds and builds until the table surface is entirely covered! In such cases other modalities would have to be used to inform the user that content is appearing on the display. Ambient lights placed around the table surface, for example, could glow to inform the user that information is shown on screen. Alternatively, audio or music notifications could be used.
5. Intentional occlusion
Occlusion can often be meaningful. Digital and physical documents may be grouped together on the tabletop; in this case the occlusion is semantically meaningful. Future work could look at how occlusion management could be toggled to allow semantically meaningful occlusion, preventing these piles of related content from being rearranged on the surface.
6. 3D Occlusion
A brief photo-study performed during this project investigated how people use coffee tables in their homes. We found that 3D occlusion (where parts of the surface are hidden due to the height of items atop the table) was not a significant problem. Our algorithm could easily be extended to deal with 3D occlusion – areas of the display in the shadow of items atop the table could be included in the occlusion matrix.
Source code
A C# implementation of the algorithm to find visible regions of the display is available here. The Region and Matrix classes shown are basically a rectangle and 2D array.